Network communication is one of the most important parts of modern iOS applications. Whether an app loads user profiles, processes payments, retrieves product information, or communicates with external services, it depends on reliable network requests.
But when something goes wrong, identifying the actual problem isn't always straightforward.
A request might fail, take too long to respond, return unexpected data, or behave differently across network environments. For iOS developers, debugging these issues can become a time-consuming process.
So, what makes network debugging in iOS applications so challenging?
1. Network Requests Have Multiple Stages
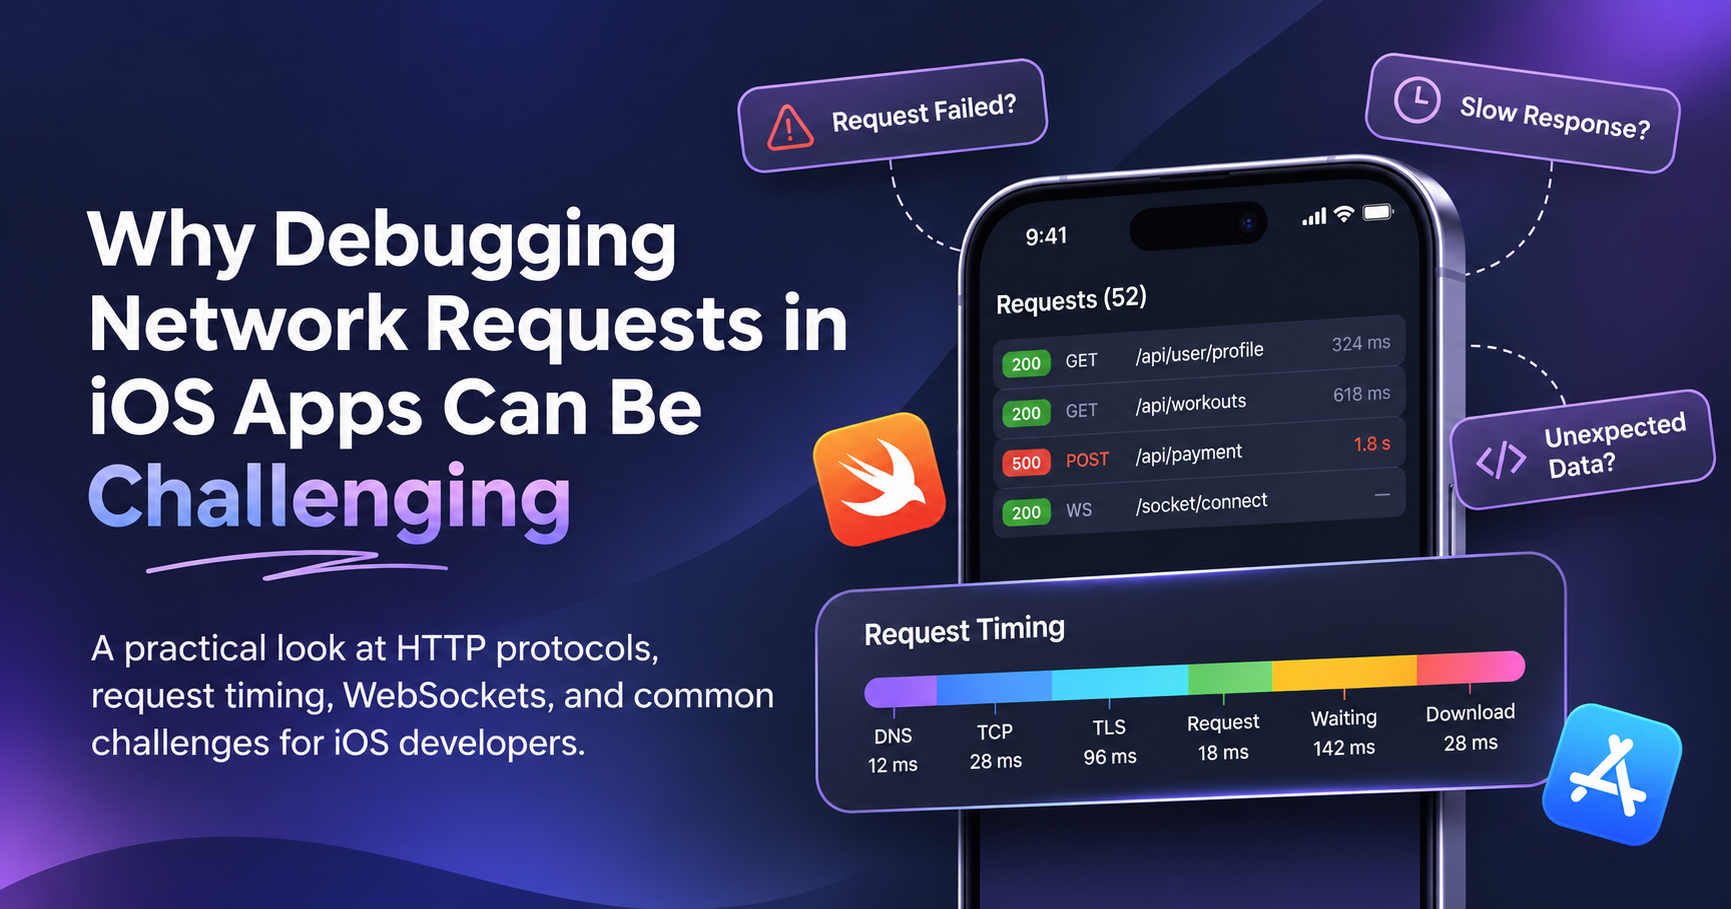
A network request is not a single operation. Several steps happen before an application receives a response.
These typically include:
- DNS lookup to resolve the server address.
- TCP connection establishment.
- TLS handshake for secure communication.
- HTTP request transmission.
- Waiting for the server response.
- Downloading response data.
When a request becomes slow, developers need to identify which stage is responsible.
For example, a slow response might not be caused by the server itself. DNS resolution, connection establishment, or TLS negotiation could be contributing to the delay.
Without phase-level timing information, finding the actual bottleneck becomes difficult.
2. Understanding HTTP Protocol Behaviour
Modern iOS applications communicate using different HTTP protocols, including HTTP/1.1, HTTP/2, and HTTP/3.
Each protocol handles network communication differently.
HTTP/1.1 generally uses separate connections for concurrent requests, while HTTP/2 supports multiplexing multiple streams over a single connection. HTTP/3 uses QUIC over UDP to improve connection handling and performance.
When debugging network issues, developers may need to understand which protocol is being used and how the connection behaves.
Simply knowing that a request failed doesn't always explain why it failed.
3. Inspecting Request and Response Data
Another challenge is understanding what is actually being sent and received.
Developers often need to inspect:
- Request headers and response headers.
- Authentication tokens and cookies.
- Request parameters and payloads.
- HTTP status codes.
- Response body content.
- Server error messages.
A successful HTTP response doesn't necessarily mean the application received the expected data.
For example, an API might return a successful status code but contain unexpected fields or missing values. Inspecting the complete response helps developers identify these issues faster.
4. Debugging WebSocket Connections
Not every application relies only on traditional HTTP requests.
Real-time applications often use WebSockets for continuous communication between clients and servers.
Examples include chat applications, live notifications, collaborative tools, and real-time dashboards.
Debugging WebSockets can be particularly challenging because developers need to understand individual frames, message direction, connection behaviour, and payload content.
Looking at a connection without being able to inspect its individual messages makes troubleshooting much harder.
5. Reproducing Network Issues Is Difficult
Some network problems only occur under specific conditions.
An API might work perfectly on Wi-Fi but fail on mobile data. A request might succeed during development but behave differently in production.
Common causes include:
- Unstable internet connections.
- Server timeouts.
- Authentication failures.
- Unexpected API responses.
- SSL/TLS configuration issues.
- Backend performance problems.
Reproducing these situations consistently is essential for identifying the root cause.
6. Choosing the Right Debugging Approach
Xcode provides useful debugging capabilities, including debugging tools and network inspection through Instruments.
However, developers may still need more detailed visibility into individual requests, connection timing, response bodies, and WebSocket communication.
Having the right network inspection workflow can make a significant difference.
For example, tools such as Owlse help iOS developers inspect network requests, analyse timing across individual request phases, review headers and response bodies, and examine WebSocket frames.
This makes it easier to understand what happens during network communication instead of relying only on error messages.
Final Thoughts
Network debugging is challenging because many different components work together behind every request.
A small issue in DNS resolution, connection establishment, TLS negotiation, server response time, or data handling can affect the entire application experience.
For iOS developers, the goal should not simply be to identify failed requests but to understand why they fail and where the problem originates.
Better visibility into network communication leads to faster troubleshooting, more reliable applications, and a better experience for users.
About the author
- I write about iOS development, mobile networking, developer tools, software engineering, and emerging technologies. My goal is to turn complex technical concepts into practical, easy-to-understand content for developers.
Comments
Join the discussionNo comments yet. Be the first to comment.