
You Sent One Request. Your iOS App Did Six Things First.
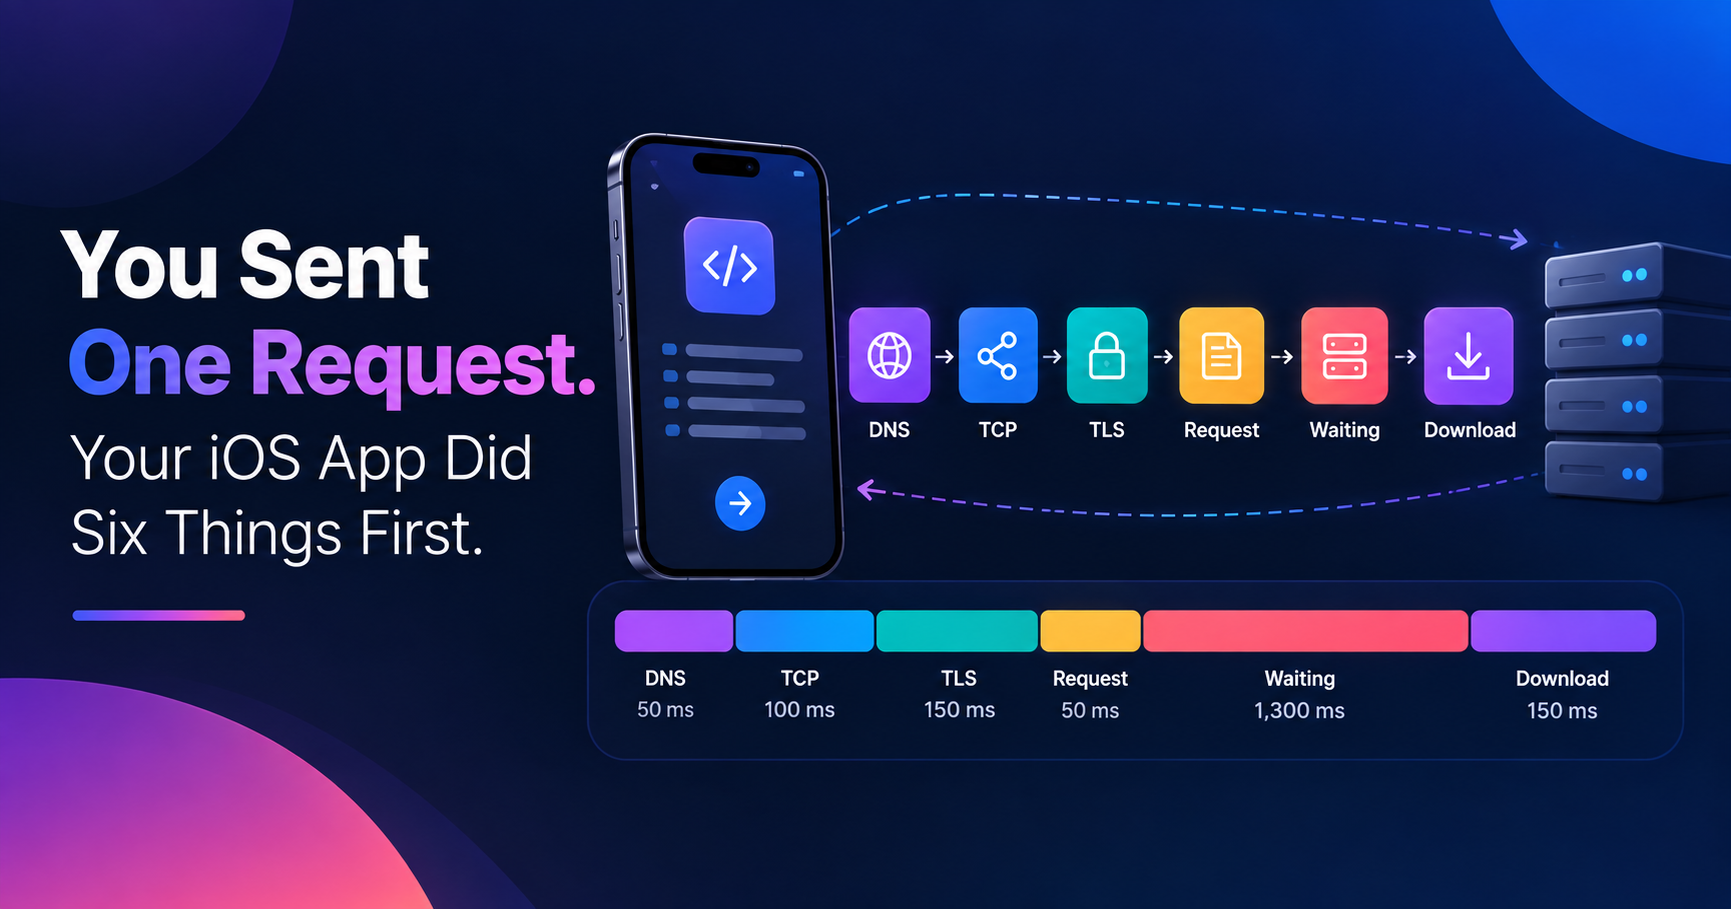
When an iOS API call takes 2 seconds, what do you usually do?
Check the backend logs?
Look at the API response time?
Blame the network?
That can be a mistake.
A network request isn't a single operation. Before your application receives a response, several things can happen:
DNS → TCP → TLS → Request → Waiting → Download
Understanding each stage gives you a much better way to diagnose networking problems in iOS.
What Actually Happens During an API Request?
Let's follow a typical HTTPS request from an iOS application.
iOS App
   │
   ▼
 DNS Resolution
   │
   ▼
 TCP Connection
   │
   ▼
 TLS Handshake
   │
   ▼
 HTTP Request
   │
   ▼
 Server Processing
   │
   ▼
 Response Download
   │
   ▼
 iOS App
Each stage can contribute to the total latency.
1. DNS Resolution
Suppose your application calls:
https://api.example.com/users
Before connecting to the server, the hostname needs to be resolved to an IP address.
This is the DNS stage.
If DNS resolution is slow, the request can experience noticeable latency before the server receives anything.
When debugging a slow request, don't assume the server is responsible for all of the elapsed time.
2. TCP Connection
Once the destination is known, a TCP connection may need to be established.
TCP provides reliable communication between the client and server.
Connection setup can add latency when:
A new connection needs to be created
The network has high latency
The server is geographically distant
Connections aren't being reused effectively
This is another reason why total request duration doesn't automatically equal backend processing time.
3. TLS Handshake
For HTTPS, the connection also needs to be secured.
TLS establishes the encrypted connection between the client and server.
Depending on the connection and protocol, the TLS handshake can contribute additional latency.
When investigating performance, being able to separate TCP and TLS timing can help identify whether connection establishment is part of the problem.
4. Sending the HTTP Request
Now your application can send the actual HTTP request.
For example:
GET /users HTTP/2
Host: api.example.com
Authorization: Bearer ...
The request may contain:
HTTP method
URL
Headers
Cookies
Query parameters
Request body
At this point, the request has finally reached the application layer.
5. Waiting for the Server
Now comes the part developers usually focus on.
The server processes the request.
It could be:
Querying a database
Calling another service
Performing authentication
Running business logic
Generating a response
If this stage takes 1.5 seconds, the backend may genuinely be the bottleneck.
But you won't know that without separating it from the other stages.
6. Downloading the Response
The server has responded, but your application still needs to receive the data.
A small JSON response and a 20 MB response can produce very different experiences.
For example:
{
  "id": 123,
  "name": "Alex",
  "status": "active"
}
is very different from downloading a large payload containing thousands of records, images, or other data.
Response size and network conditions both matter.
Why Total Request Time Isn't Enough
Imagine your request takes 2 seconds.
You could simply say:
"The API takes 2 seconds."
But consider this breakdown:
DNS       50 ms
TCP      100 ms
TLS      150 ms
Request   50 ms
Waiting 1300 ms
Download 350 ms
----------------
Total   2000 ms
Now you have useful information.
The biggest contributor is server-side waiting.
Compare that with:
DNS      450 ms
TCP      350 ms
TLS      300 ms
Request   50 ms
Waiting  450 ms
Download 400 ms
----------------
Total   2000 ms
Both requests take exactly 2 seconds.
But they're completely different performance problems.
The first points toward server processing.
The second suggests connection and network latency deserve investigation.
HTTP/1.1, HTTP/2, and HTTP/3 Matter
The protocol being used can also affect how requests behave.
HTTP/1.1
HTTP/1.1 is widely supported and uses traditional request/response communication over TCP.
HTTP/2
HTTP/2 introduces features such as multiplexing, allowing multiple streams to share a connection.
HTTP/3
HTTP/3 uses QUIC over UDP rather than TCP and is designed to improve connection establishment and performance under certain network conditions.
For mobile developers, knowing which protocol a request is actually using can provide useful debugging context.
What About WebSockets?
Not every networking problem involves REST APIs.
Real-time applications often use WebSockets.
Unlike a typical HTTP request, a WebSocket connection can remain open and exchange messages in both directions.
That changes how you debug it.
Instead of looking only at request duration, you may need to inspect individual frames:
Connection
 ├── Client → Server
 │    └── JSON message
 │
 ├── Server → Client
 │    └── Response
 │
 ├── Client → Server
 │    └── Event
 │
 └── Server → Client
      └── Update
Frame direction, type, size, and payload can all become useful when investigating unexpected behavior.
A Better Debugging Workflow
Instead of starting with:
"Why is this API slow?"
try asking:
Where is the time being spent?
A practical workflow is:
Step 1: Measure total duration
Find out how long the request actually takes.
Step 2: Break it into phases
Separate DNS, TCP, TLS, request, waiting, and download.
Step 3: Check the protocol
Determine whether you're using HTTP/1.1, HTTP/2, HTTP/3, or another communication mechanism.
Step 4: Inspect request and response data
Look at headers, cookies, body size, and response content.
Step 5: Compare requests
Compare a slow request against a successful or faster request.
Patterns become much easier to identify when you have something to compare against.
The Main Lesson
A network request may look like one line of code:
URLSession.shared.dataTask(with: request)
But underneath that line is an entire sequence of network operations.
If you're only looking at the final response time, you're seeing the symptom — not necessarily the cause.
Breaking the request into individual phases gives you a much clearer picture of what's happening between your iOS application and the server.
That's where tools such as Owlse can help. Instead of treating a request as one black box, it gives developers visibility into request phases, protocols, TLS details, WebSocket frames, headers, bodies, timing, and more.
Because when an app is slow, the most useful question isn't:
"How long did the request take?"
It's:
"Where did those milliseconds go?"